How to identify no supply and no demand candles.
In past articles we have talked about pin bar reversal candles, and outside bars, as potential areas in the market where price can reverse. I now want to look at another candle formation that can also be an indication of a potential reversal signal.
No supply and no demand candles take into consideration the buying and selling volume within the candle formation. By studying the volume within a candle, you can establish where buyers and sellers are active or inactive in the market.
No Supply Candles. (No Sellers)
No supply candles indicate a potential long trade. The criteria for a no supply candle is as follows.
The Volume within the candle formation has to be lower than the volume of the previous 2 candles.
The candle has to close bearish (red body).
There has to be some sort of rejection (pin or wick) at the low of the candle.
If the candle closed at the bottom it would not be a no supply candle.
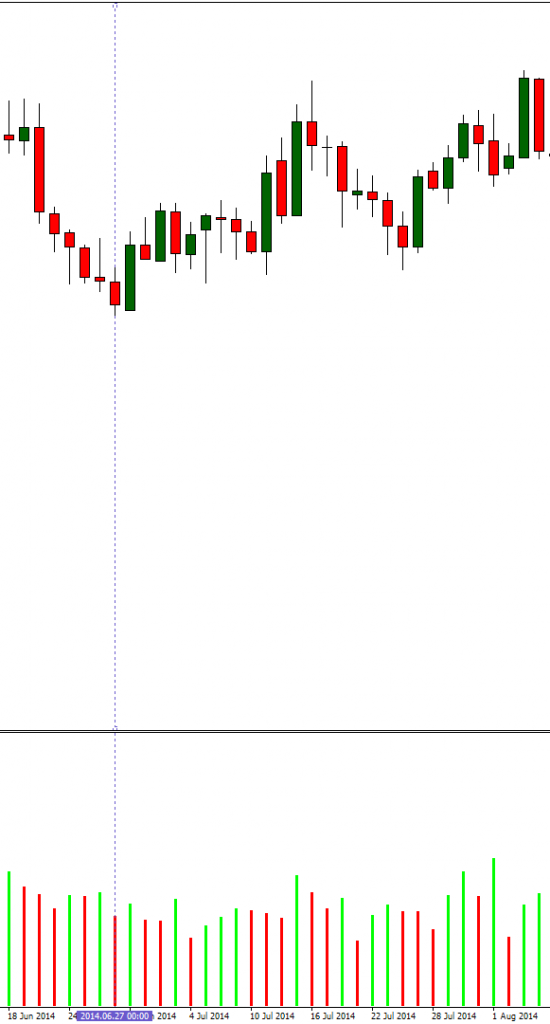
Below is an example of a no supply candle on a daily chart. The dotted line highlights the bearish candle with rejection at the low, and lower volume than the previous 2 candles.
As you can see it was a nice reversal level in the pair, and went on to produce some nice pips.
No Demand Candles. (No Buyers)
No demand candles indicate a potential short trade. The criteria for a no demand candle is as follows.
The Volume within the candle formation again has to be lower than the volume of the previous 2 candles.
The candle has to close bullish (green body).
There has to be some sort of rejection (pin or wick) at the high of the candle.
If the candle closed at the top it would not be a no supply candle.
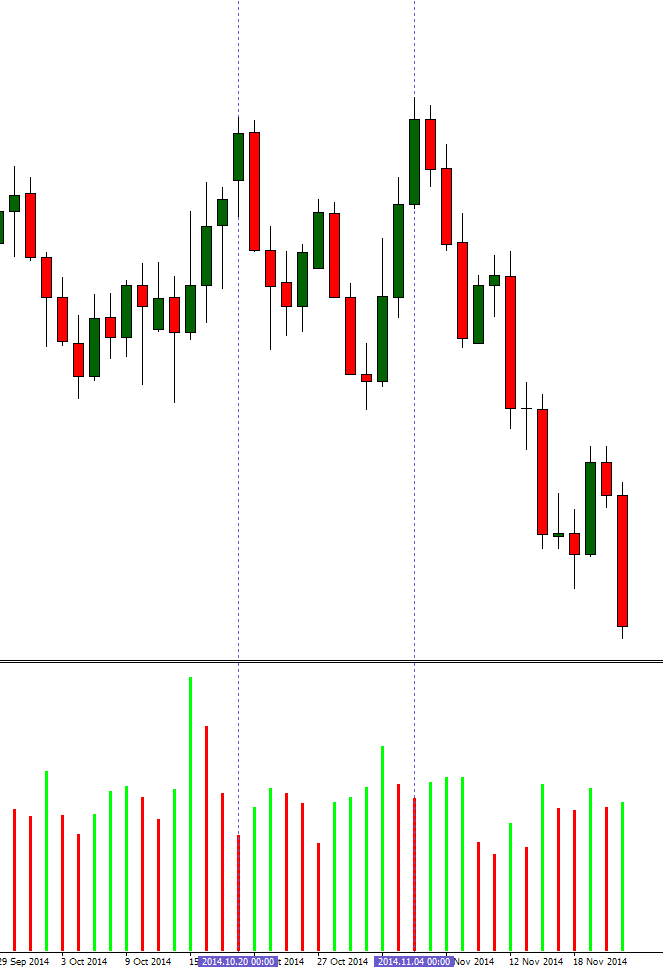
Below is an example of two no demand candles on a daily chart. The dotted lines highlight the bullish candles with rejection at the high, and lower volume than the previous 2 candles.
The two no demand candles both produced nice trades, but more importantly they also formed a double top in the market, which is another good reversal signal in itself.
If you look at the second no demand candle, you will also see an inside bar next to it, which is a sign of indecision in the market. A nice 50% retrace entry on that too before the sell off 🙂
Using no supply and no demand candles as potential reversal points within supply and demand areas is a trading strategy that can produce some nice results.
If you enjoyed this article and you think it would benefit others then please feel free to like it on Facebook, share it on Twitter or bookmark it using the bookmarking buttons below.
Thanks for visiting and have a great day. 😉


