High Probability Reversal Patterns.

One of the keys to success in the Forex business, is having the ability to identify high probability reversal patterns on the chart.

There are many reversal patterns that present themselves on the chart every day, but not all of them are high probability. I am going to talk about some of the better patterns and how you can use them in your trading.

The Engulfing Candle.
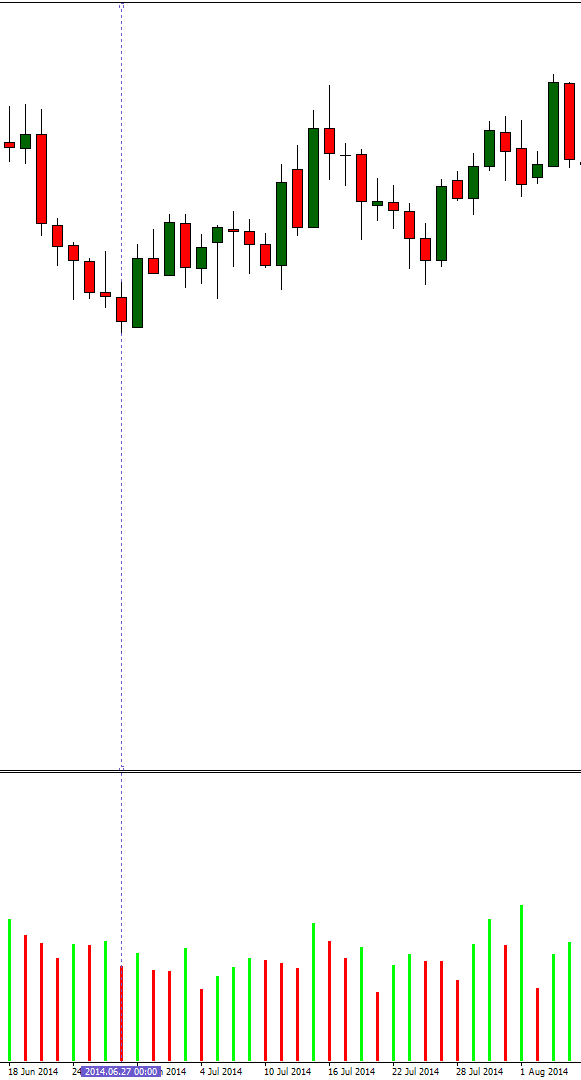
engulfing candleAn engulfing candle or outside bar as its sometimes called, represents a complete change in trader sentiment. The way an engulfing candle forms is probably one of the biggest clues that a reversal or a potential reversal is on the cards.

Engulfing candles often form at the end of a trend and can be great reversal signals. The logic behind the engulfing candle is very powerful indeed, and the candle will change bulls into bears and bears into bulls in a very short space of time.

An engulfing candle is a very basic price action set up, but works very well at key reversal levels in the market. For more information on how to trade engulfing candles click here.

The Inside Bar.

inside bar
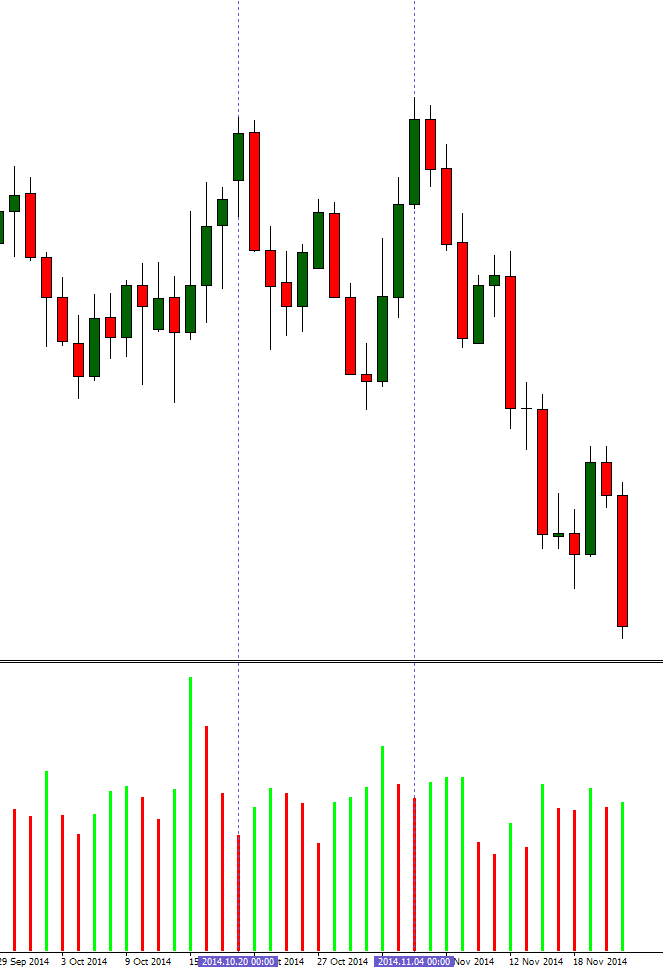
An inside bar is basically a candle that forms inside another candle. Inside bars represent indecision in the market, and can be good indications of a potential reversal. They are not as powerful as engulfing candles, but when traded at good levels, they can produce a successful trade.

Inside bars can also produce a nice breakout trade. Breakouts work best when you have a multiple inside bar set up. A multiple inside bar set up can sometimes be called a flag, or a pennant. Multiple inside bar set ups will produce a much stronger breakout trade than a one bar set up, purely because the volume of orders in the market will be much larger, and as the price breaks out, and the stops are hit the move will be more powerful.

For more information on how to trade inside bars click here.

The Head And Shoulders Pattern.

The head and shouldlers, or inverse head and shoulders pattern, is also a very good reversal pattern and you will often find them at the end of trends, and at major turning points in the market. The head and shoulders pattern can be a very profitable pattern if you know how to trade it correctly.

Below is a picture of a head and shoulders pattern. You can also see that the right shoulder is made up of an engulfing candle, which makes the set up even stronger.head and shoulders

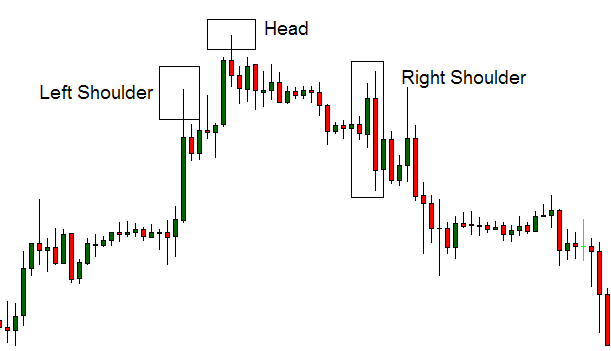
This set up works well when the left shoulder and the right shoulder are at the same level, but this does not always have to be the case for a head and shoulders reversal to work, but the head always has to be above the left and the right shoulder.

These are just some basic price action reversal patterns that you can use to help you in your trading. If you want to learn more advanced high probability reversal patterns please consider my Forex training course.

What Are No Supply And No Demand Candles?

How to identify no supply and no demand candles.

In past articles we have talked about pin bar reversal candles, and outside bars, as potential areas in the market where price can reverse. I now want to look at another candle formation that can also be an indication of a potential reversal signal.

No supply and no demand candles take into consideration the buying and selling volume within the candle formation. By studying the volume within a candle, you can establish where buyers and sellers are active or inactive in the market.

No Supply Candles. (No Sellers)

No supply candles indicate a potential long trade. The criteria for a no supply candle is as follows.

The Volume within the candle formation has to be lower than the volume of the previous 2 candles.
The candle has to close bearish (red body).
There has to be some sort of rejection (pin or wick) at the low of the candle.
If the candle closed at the bottom it would not be a no supply candle.

Below is an example of a no supply candle on a daily chart. The dotted line highlights the bearish candle with rejection at the low, and lower volume than the previous 2 candles.

As you can see it was a nice reversal level in the pair, and went on to produce some nice pips.

no supply candle

No Demand Candles. (No Buyers)

No demand candles indicate a potential short trade. The criteria for a no demand candle is as follows.

The Volume within the candle formation again has to be lower than the volume of the previous 2 candles.
The candle has to close bullish (green body).
There has to be some sort of rejection (pin or wick) at the high of the candle.
If the candle closed at the top it would not be a no supply candle.

Below is an example of two no demand candles on a daily chart. The dotted lines highlight the bullish candles with rejection at the high, and lower volume than the previous 2 candles.

The two no demand candles both produced nice trades, but more importantly they also formed a double top in the market, which is another good reversal signal in itself.

no demand candles

If you look at the second no demand candle, you will also see an inside bar next to it, which is a sign of indecision in the market. A nice 50% retrace entry on that too before the sell off 🙂

Using no supply and no demand candles as potential reversal points within supply and demand areas is a trading strategy that can produce some nice results.

If you enjoyed this article and you think it would benefit others then please feel free to like it on Facebook, share it on Twitter or bookmark it using the bookmarking buttons below.

Thanks for visiting and have a great day. 😉

Forex Candlestick Patterns. How To Trade Outside Bars.

What is an outside bar?

how to trade outside barsAnother very common and successful candlestick pattern is an outside bar, or engulfing bar as they are sometimes called, because they engulf the previous candle. Knowing how to trade outside bars will put plenty of pips in your trading account. Outside bar candlestick patterns are far more reliable trading signals than inside bar patterns are. If you know how to trade inside bars then trading outside bars is very much the same.

The picture on the right shows a bearish outside bar candlestick pattern. Here you can see that the bearish red candle is completely outside the bullish green candle. The red candle completely engulfs it, hence the term engulfing bar.

Why are outside bars more reliable than inside bars?

Outside bars represent a total shift in sentiment (in this case from bullish to bearish). The bearish price action in the red candle is far greater than the bullish green candle, so we have had a total shift in sentiment from bullish to bearish. The red candle is twice the size of the green candle which indicates strong selling pressure.

If you compare the outside bar price action to the price action of an inside bar, where the candle is a lot smaller than the preceding mother candle, you can understand that a bigger candle means a bigger shift in sentiment, which equals a more reliable trade, and that is why outside bars are more reliable candlestick patterns than inside bars are.

How to trade outside bars.

The general rules on how to trade outside bars would be to enter the trade at the breakout of the red outside bar. Some traders prefer to see a retrace of the outside bar before taking the trade. The only problem with taking the trade on a retrace of the outside bar, is you may not get a breakout, you may get another inside bar instead, and then the trade becomes a lot less reliable.

My advice would be similar to the advice i gave on how to trade inside bars, which is wait for the breakout, and then look for the retrace, before entering.

For more information on how to trade outside bars please consider my Forex training course.

If you found this article to be helpful to you, please like it on Facebook, share it on Twitter, or bookmark it using the social bookmarking buttons below. Thanks. 🙂