How To Be A Sucessful Forex Trader Using Market Logic.

In order to be a successful Forex trader you have to keep it simple. I have many profitable strategies that i use to make money from trading, but they are all based around simple market logic.

So what is market logic?

To understand market logic you have to understand the major forces that drive the market. What makes prices move up and down?

Most traders think that buyers and sellers move the market up and down. Now although that is true its not the only factor that drives price.

Other factors that influence price.

Think about this. When you enter a trade you buy or sell the market at a specific price. Now whether that trade is successful or not, you will have to exit that trade at some point in the future.

So say you buy the market, and set a take profit and a stop loss. Now in order for you to exit that trade, whether in profit or loss, your buy order will have to sell the market at some point to close out your position. So just by closing your trade you are influencing price.

The power of the majority.

If everyone is selling the market, why would you want to buy it? If everyone is buying the market why would you want to sell it?

This is a mistake that a lot of retail traders make. They try to catch tops and bottoms. I have done this myself when i first started out. How many times have you seen prices going down, and thought its going to reverse here, this is the bottom. So you pile in, only to see it go further down, and you think why is it going down, and down and down?

Well think about it logically. You buy at what you think is the bottom, and a few 100 others do the same, because lets face it, its not only going to be you that thinks its the bottom, there will be 1000s of other retail traders that think the same thing, who will also be buying at various levels.

So if all of these retail traders are buying, why is it still going down. Because the majority are still selling, and your buy orders are adding to that selling pressure.

How can buy orders add to selling pressure?

Well think about the other factors that influence price. Buy orders are seen as positive by the majority of traders, but when you have a strong downtrend they are negative. They are fuel for the fire of the downtrend. Why? because those buy orders are closed out with sell orders.

So as uninformed retail trades are trying to catch tops and bottoms, their stop losses are adding strength to the move, as those buy orders close as sell orders. Even if some traders do manage to catch a temporary bottom, when they close the trade for a small profit, their sell orders will send prices down again.

Major reversals in the market.

So if what im saying is true, and it is, what makes the market reverse, if its not buyers? Well if its not buyers that make the market reverse, it must be sellers right? Yes, but not just sellers. There are 3 main factors that will make the market reverse from a strong downtrend, or a strong uptrend. Buyers, sellers, and profit takers.

In this case we will work with the downtrend. As we have already established by trading against the majority you will lose your money.

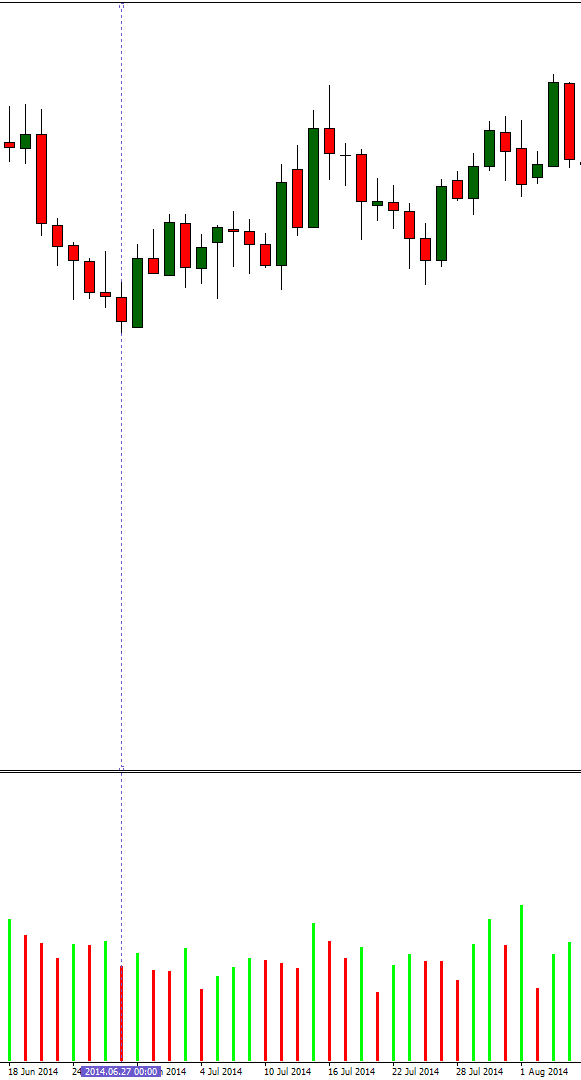
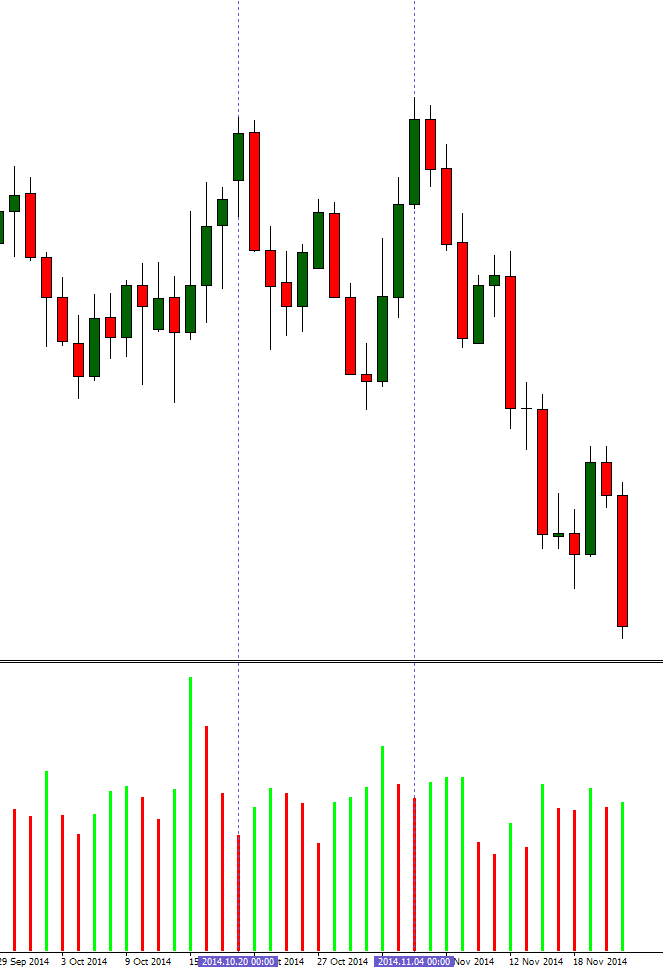
The picture below shows how buyers, sellers, and profit takers affect the market.

Market Logic

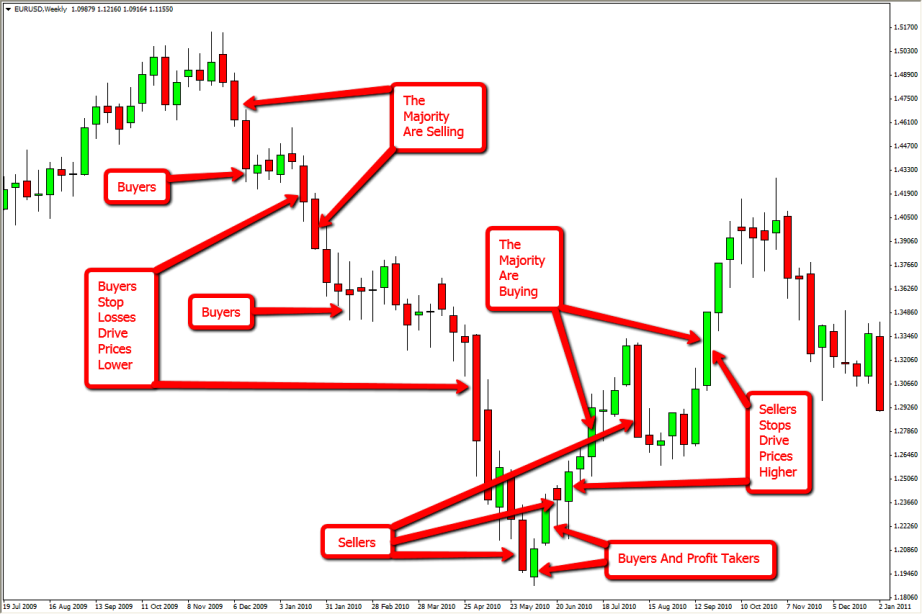
In order to avoid losing money in the market, you always have to be on the correct side of the move, and trade with the majority. Following the trend is not always the answer though, as you can see how the buyers and sellers in that downtrend got smoked by entering at the wrong time. You have to enter and exit the market at key reversal levels in order to be successful.

My Forex training course will show you how to enter and exit the maket safely, and how to trade alongside the professionals.

If you enjoyed this article, and you think it would benefit other traders, please like it on Facebook, share it on Twitter, or bookmark it using the buttons below. Thanks for visiting and have a great day.

High Probability Reversal Patterns.

One of the keys to success in the Forex business, is having the ability to identify high probability reversal patterns on the chart.

There are many reversal patterns that present themselves on the chart every day, but not all of them are high probability. I am going to talk about some of the better patterns and how you can use them in your trading.

The Engulfing Candle.

engulfing candleAn engulfing candle or outside bar as its sometimes called, represents a complete change in trader sentiment. The way an engulfing candle forms is probably one of the biggest clues that a reversal or a potential reversal is on the cards.

Engulfing candles often form at the end of a trend and can be great reversal signals. The logic behind the engulfing candle is very powerful indeed, and the candle will change bulls into bears and bears into bulls in a very short space of time.

An engulfing candle is a very basic price action set up, but works very well at key reversal levels in the market. For more information on how to trade engulfing candles click here.

The Inside Bar.

inside barAn inside bar is basically a candle that forms inside another candle. Inside bars represent indecision in the market, and can be good indications of a potential reversal. They are not as powerful as engulfing candles, but when traded at good levels, they can produce a successful trade.

Inside bars can also produce a nice breakout trade. Breakouts work best when you have a multiple inside bar set up. A multiple inside bar set up can sometimes be called a flag, or a pennant. Multiple inside bar set ups will produce a much stronger breakout trade than a one bar set up, purely because the volume of orders in the market will be much larger, and as the price breaks out, and the stops are hit the move will be more powerful.

For more information on how to trade inside bars click here.

The Head And Shoulders Pattern.

The head and shouldlers, or inverse head and shoulders pattern, is also a very good reversal pattern and you will often find them at the end of trends, and at major turning points in the market. The head and shoulders pattern can be a very profitable pattern if you know how to trade it correctly.

Below is a picture of a head and shoulders pattern. You can also see that the right shoulder is made up of an engulfing candle, which makes the set up even stronger.head and shoulders

This set up works well when the left shoulder and the right shoulder are at the same level, but this does not always have to be the case for a head and shoulders reversal to work, but the head always has to be above the left and the right shoulder.

These are just some basic price action reversal patterns that you can use to help you in your trading. If you want to learn more advanced high probability reversal patterns please consider my Forex training course.

What Are No Supply And No Demand Candles?

How to identify no supply and no demand candles.

In past articles we have talked about pin bar reversal candles, and outside bars, as potential areas in the market where price can reverse. I now want to look at another candle formation that can also be an indication of a potential reversal signal.

No supply and no demand candles take into consideration the buying and selling volume within the candle formation. By studying the volume within a candle, you can establish where buyers and sellers are active or inactive in the market.

No Supply Candles. (No Sellers)

No supply candles indicate a potential long trade. The criteria for a no supply candle is as follows.

The Volume within the candle formation has to be lower than the volume of the previous 2 candles.
The candle has to close bearish (red body).
There has to be some sort of rejection (pin or wick) at the low of the candle.
If the candle closed at the bottom it would not be a no supply candle.

Below is an example of a no supply candle on a daily chart. The dotted line highlights the bearish candle with rejection at the low, and lower volume than the previous 2 candles.

As you can see it was a nice reversal level in the pair, and went on to produce some nice pips.

no supply candle

No Demand Candles. (No Buyers)

No demand candles indicate a potential short trade. The criteria for a no demand candle is as follows.

The Volume within the candle formation again has to be lower than the volume of the previous 2 candles.
The candle has to close bullish (green body).
There has to be some sort of rejection (pin or wick) at the high of the candle.
If the candle closed at the top it would not be a no supply candle.

Below is an example of two no demand candles on a daily chart. The dotted lines highlight the bullish candles with rejection at the high, and lower volume than the previous 2 candles.

The two no demand candles both produced nice trades, but more importantly they also formed a double top in the market, which is another good reversal signal in itself.

no demand candles

If you look at the second no demand candle, you will also see an inside bar next to it, which is a sign of indecision in the market. A nice 50% retrace entry on that too before the sell off 🙂

Using no supply and no demand candles as potential reversal points within supply and demand areas is a trading strategy that can produce some nice results.

If you enjoyed this article and you think it would benefit others then please feel free to like it on Facebook, share it on Twitter or bookmark it using the bookmarking buttons below.

Thanks for visiting and have a great day. 😉

Why Do Pin Bar Reversal Candles Fail?

If you read my article on the pin bar rejection candle, you should know what one is. But not all pin bar reversal candles, or rejection candles work out. Why do some pin bar reversal candles fail, while others pay out?

Here are 3 reasons why pin bar reversal candles could fail.

1. A news release.

A classic reason for a pin bar reversal failure is a news release. I do not trade through news, but news can dramatically affect the likelihood of a successful outcome of a pin bar reversal set up. As a Forex trader you should always be aware of news releases, to make sure you are not either in a trade when news is coming up, or are about to get into a trade when news is pending. I subscribe to a news feed called Talking Forex that keeps me updated on any price sensitive news no matter how small it may be.

2. The components of the pin bar reversal candles.

bearish pin bar reversal candleHow the candle is made up can also affect how successful the set up will be. The ideal components of pin bar reversal candles are a long pin, or wick as some people call it, and a small body. If the body is too large, or the pin is too small the likelihood is it will not work.

The picture on the right is a great example of a bearish pin bar reversal candle. You can see the wick is nice and large, and the body is small. It is also beneficial that the body is red if its a bearish candle, as this one is, or that it is green in the case of a bullish reversal candle.

You can see how successful this bearish pin bar set up is by the strong move down on the candle to the right of the pin bar. A lot of Forex traders would have recognized this great pin bar set up and quickly jumped into short positions to promote the aggressive move down in price that we can see.

3. The location of the pin bar reversal candles.


The location of the pin bar is a common reason for a pin bar set up to fail. If the pin bar is located at the wrong position within a trend it will fail. Pin bars work best when they are located at a swing high or swing low within a trend.

If a pin bar is located between 2 candles there is also a likelihood that it will fail. The pin bar set up works better when the pin bar is protruding from the 2 candles either side of it.

failed pin bar reversal chart

The chart above shows a number of pin bar set ups. Two that have failed and one that has worked out nicely. The two that have failed are marked with arrows.

You can clearly see from left to right that the first pin bar has failed for 2 reasons. The first reason was the size of the body. The second reason is the location within the trend. Also the body is bullish (green) and it should ideally be bearish (red).

The second pin bar set up worked out nicely for 4 reasons. The pin bar has a nice small body, that is the correct colour for a bearish set up (red), and its at the swing high within the down trend, and it is protruding from the candles around it.

The third pin bar failed because of its location within the trend and the candles either side of it. You can see that the pin bar has a nice wick and a very small almost non existent body, which is very good, but its totally in the wrong position within the move down, it is positioned at a swing low, and it is overpowered by the 2 candles either side of it.

Pin bar reversal candles work very well when the correct set up presents itself. This article covers basic price action set ups. What i teach is advanced price action trading. If you wish to learn how to trade Forex using advanced high probability price action Forex trading, please consider my Forex training course.

If you found this article to be helpful to you, please like it on Facebook, share it on Twitter, or bookmark it using the social bookmarking buttons below. Thanks. 🙂

Forex Candlestick Patterns. The Pin Bar Rejection Candle.

There are many Forex candlestick patterns, but in this article we will look at a bearish pin bar rejection candle.

A pin bar, or hammer candle, as some traders call it, is a very good signal of a price reversal. Price reversals are the holy grail of Forex trading, and my whole trading strategy is based on using Forex candlestick patterns, to find levels on the chart, where there is a high probability that the price will reverse. If you can identify price reversals with high probability, then you will consistently make money from Forex trading. Forex candlestick patterns are a major part of price action Forex trading, and when mastered they can produce some very profitable trades.

Forex candlestick patterns

So what is a pin bar rejection candle, and how is it formed?

The above chart shows a bearish pin bar reversal candle on the Euro Dollar pair that formed this week, which resulted in a very profitable trade. I took this trade and banked 83 pips from the move down.

The concept behind this bearish pin bar candle, or any pin bar candle is shift in sentiment. In this pin bar candle the sentiment shifted from bullish to bearish. At one point in the candle formation the candle was totally green, and buyers were in control of price, and were happy to buy at this level. At the top of the pin bar the buyers ran out, and the sellers took over, forcing the price back to almost the opening level.

As this pin bar is a 4 hour candle, the buyers at the top of the candle were now sitting on heavy losses, and the sellers were sitting on a nice profit. Now, one of 2 things can happen next, buyers could either see value at a lower price, and add to their position, which would push the price back up and force sellers out, or they could have a shift in sentiment and close their trade for a loss, which would further add to the selling pressure, and push the price down further. In this case they had a change of heart and closed their trades for a loss. This change of sentiment together with sellers adding to their already profitable positions, sees the price move lower. When the candle closes as a pin bar, this signals that sellers are in control of price, and more sellers join the party, which pushes the price down further, and starts a major move down.

To add to the negative sentiment the pin bar has rejected at a key level of resistance, which encourages even more sellers into the market, which adds further weight to the move down.

Forex Candlestick Patterns.

If you study Forex candlestick patterns, you will see the pin bar rejection candle on many different time frames, and at many different levels on the chart, but they do not always indicate that a reversal is imminent. Some work, but some fail. You have to know with the highest probability which ones will work, and which ones will fail, and this is where i come in. I have studied Forex candlestick patterns for over 8 years and i can predict with the highest probability which will work and which will fail. Please see my Forex training course for more information.

If you found this article to be helpful to you, please like it on Facebook, share it on Twitter, or bookmark it using the social bookmarking buttons below. Thanks. 🙂